


Document Actions
gvSIG-Desktop 1.10. User Manual
Drawing commands (points, lines...)
Introduction
This section deals with gvSIG’s drawing commands. The rest of the commands can modify the elements but with the exception of the “copy” command, they cannot create new features and we thus require the actual drawing commands to do so.
gvSIG includes basic drawing elements, such as lines, circles or polygons, which can be used to obtain any complex drawings.
All the elements you wish to insert need one or several points to be specified so that they are correctly placed in the drawing.
Remember that the tools to insert new elements vary according to the type of layer being edited. Thus, for example, a point can only be inserted in a point-type layer and is not supported by any other type of layer.
Point
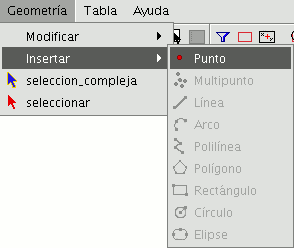
You can activate this tool by clicking on the “Point” button in the tool bar.

You can also activate it by going to the “Geometry” menu bar then to “Insert” and “Point”.
Inserting a coordinate point
A point can be referenced in two ways:
- Console mode. The point coordinates are input numerically.
- Graphic mode. The point is indicated by using any of the pointer devices (normally a mouse).
The coordinates can also be:
- Absolute: They define a point based on the coordinate source (0,0).
- Relative: They define a point based on the last defined point.
Inputting Cartesian coordinates.
Input the X and Y values separated by a comma (X,Y). The X value is the positive or negative distance, in units along the horizontal axis, the Y value is the distance in units along the vertical axis.
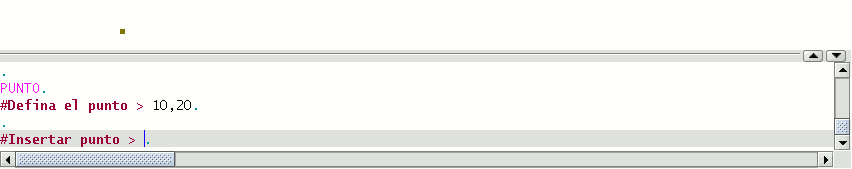
The values used to designate the points can be whole, decimal, positive or negative.
The absolute coordinate values are based on the source (0,0), which is the place the X and Y axes intersect. For example, the point 25,7 designates a point located 25 units away from the source on the X axis and 7 units away on the Y axis.
The relative values of the coordinates are based on the last input point. Use the relative coordinates when you know the coordinates of a point based on the previous point.
To designate a relative point, place the (@) symbol in front of the coordinates.
For example, the @1,2 coordinates determines a point 1 unit away on the X axis and 2 units away on the Y axis from the previously designated point.
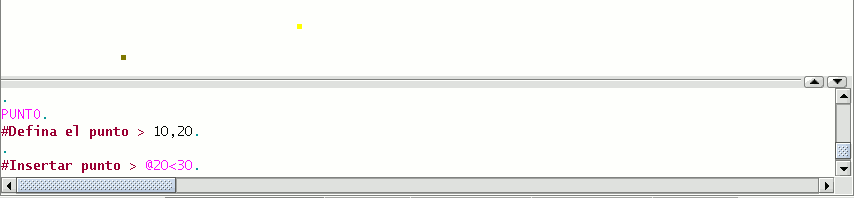
Inserting polar coordinates
To input polar coordinates, indicate a distance and an angle separated by the < symbol. For example, to designate a point 5 units away from the previous one with a 45 degree angle, write @5<45. The angles increase anti-clockwise and decrease clockwise. To move anti-clockwise, indicate a negative angle. For example, the 1<315 position is the same as the 1<-45 position.
Multipoint
You can activate this tool by clicking on the “Multipoint” button in the tool bar

or by going to the “Geometry” menu bar then to “Insert” and “Multipoint”.
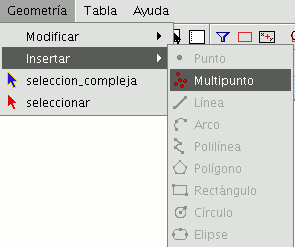
You can use the multipoint tool to create a drawing made up of a series of points which function as a single feature (i.e. we only need to select one of the points for the rest to also be selected). You need to bear in mind that this is not thus a points layer but a multipoint layer.
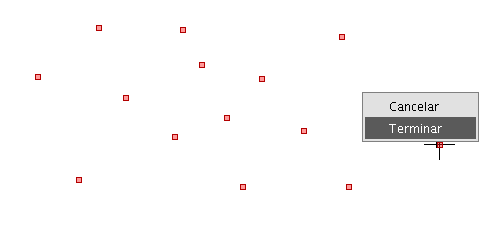
To insert a multipoint in the graphic area, select the tool and place the cursor over the part of the graphic area you wish to place the point. Left click on the mouse to insert the point. Repeat this step as many times as you wish. When you have finished adding points, right click on the mouse. A contextual menu will appear. Click on “End” to finish the new multipoint feature.
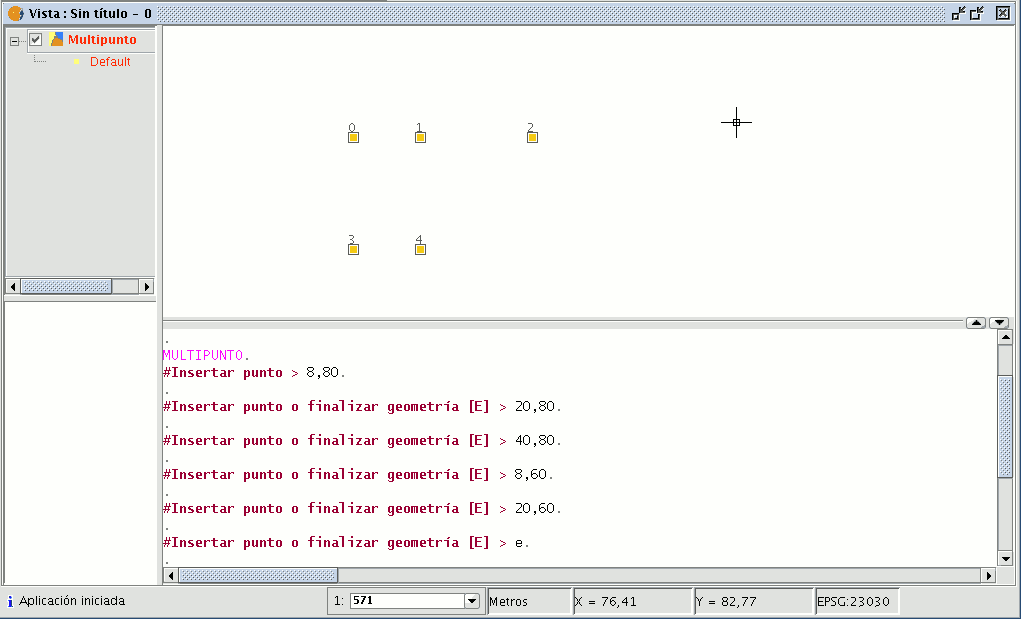
You can create a multipoint feature from the command console. To do so, write the command “multipoint”. Input the coordinates of each point you wish to add in the console and press “Enter”. To finish the insertion of the new multipoint feature, write the command “E”.
Line
This command allows you to draw a line feature, which is actually a straight line segment. This feature is limited by its initial and final points. The final point may be the start of the next segment. When the first point has been inserted an elastic line appears on the display. You can use the mouse to determine where you wish the final point to go. As with the rest of the editing tools, there are three ways to access line creation. You can go to the edition tool bar and click on the “Line” button

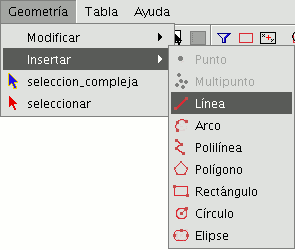
or go to the “Geometry” menu bar then to “Insert” and “Line”.
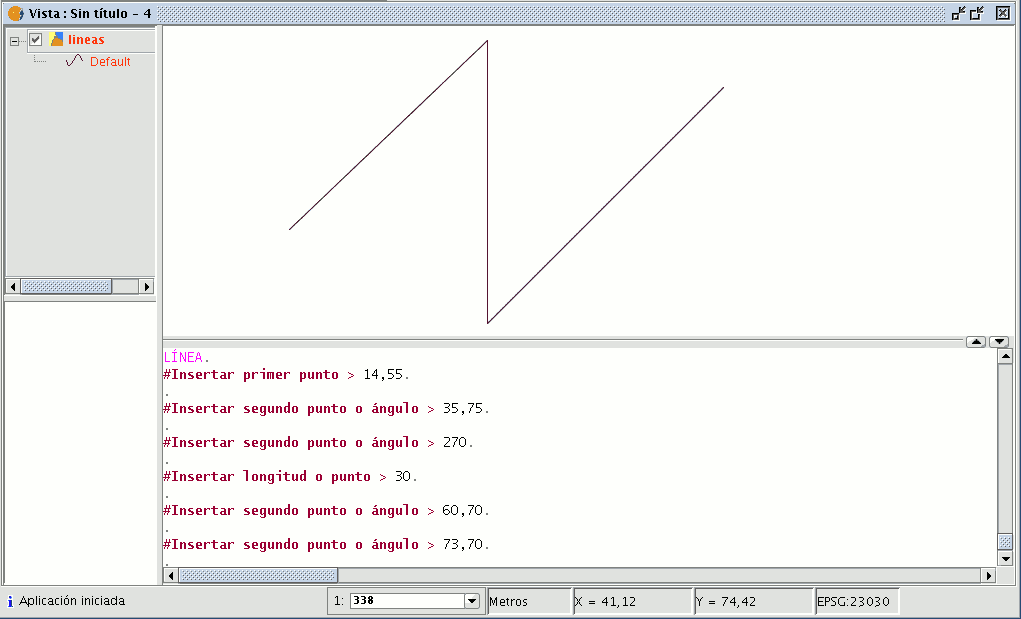
Place the cursor inside the graphic area and insert the line vertices in the desired points. gvSIG will create a projection from the last inserted point to the mouse pointer which you can use as a reference point to set the points in the drawing. You can also draw a line from the command console. Write the command “line” and then input the coordinates to define the points which delimit the segments which make up the line.
You can also insert the second and/or successive points by defining a distance and an angle. For example, to insert a point 1 unit away from the previous point at a 45º angle, write 1<45. The following image shows how a third point is inserted, after inserting the first and second points, one unit away from the previous point at a 180º angle.
Arc
You can draw an arc by clicking on the “Arc” button in the tool bar

or by going to the “Geometry” menu bar then to “Insert” and “Arc”.
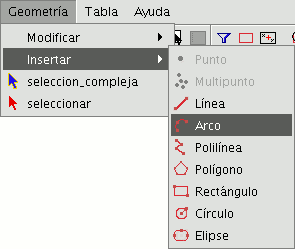
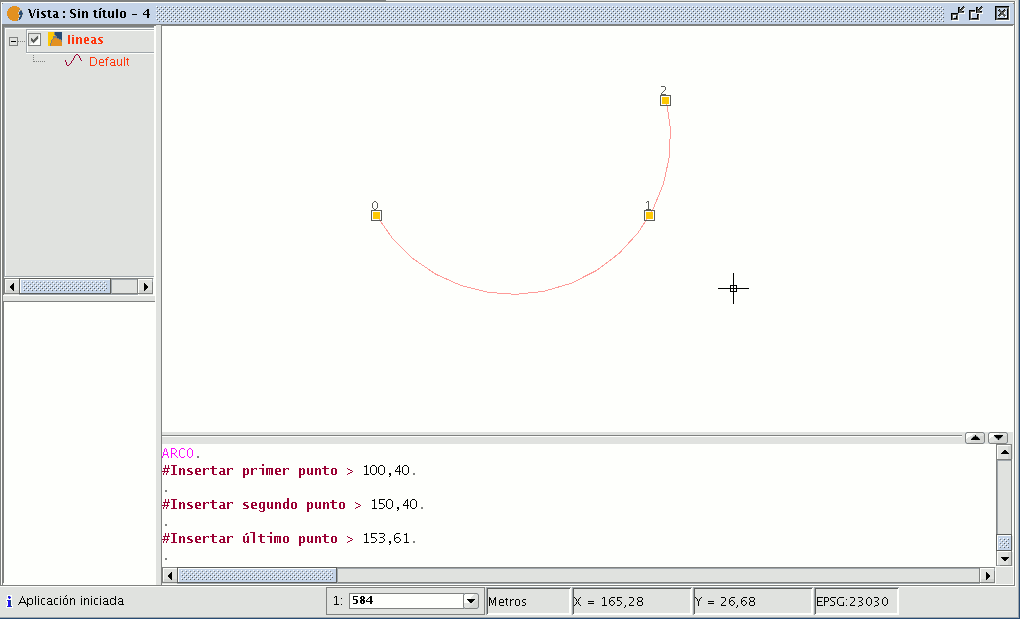
Three points are requested to draw an arc. The first and last points mark the initial and final points of the arc and the second one marks an intermediate point through which the hypothetic circle of which the arc is a part would pass. To insert an arc from the command console, write the command “arc”. The three points required to define the arc will be requested one after another.
Polyline
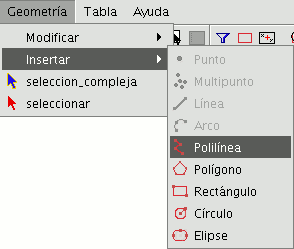
This feature can be a set of arcs and/or segments combined by the user. You can draw a polyline by selecting the tool from the edition tool bar and clicking on the “Polyline” button

or by going to the “Geometry” menu bar then to “Insert” and “Polyline”.
The polyline allows you to insert straight lines in the graphic area, but these differ from standard lines in that they allow you to insert an arc from the last vertex, to which it will always be located at a tangent, and end the polyline thus creating a polygon. Click on the graphic area in the place you wish the first point of the polyline to be located and insert the following points by left clicking on the mouse in the places you wish to locate them. If you wish to draw an arc, right click on the mouse and select the “Internal arc” option in the contextual menu.
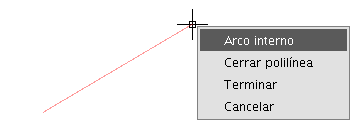
When this option has been selected, gvSIG shows a projection of an arc from the last inserted vertex to the mouse pointer.
If you wish to insert more lines, go back to the contextual menu and select the “Internal line” option.
If you wish to close the figure so that a straight line is drawn from the last inserted point to the first point, select the “Close polyline” option.
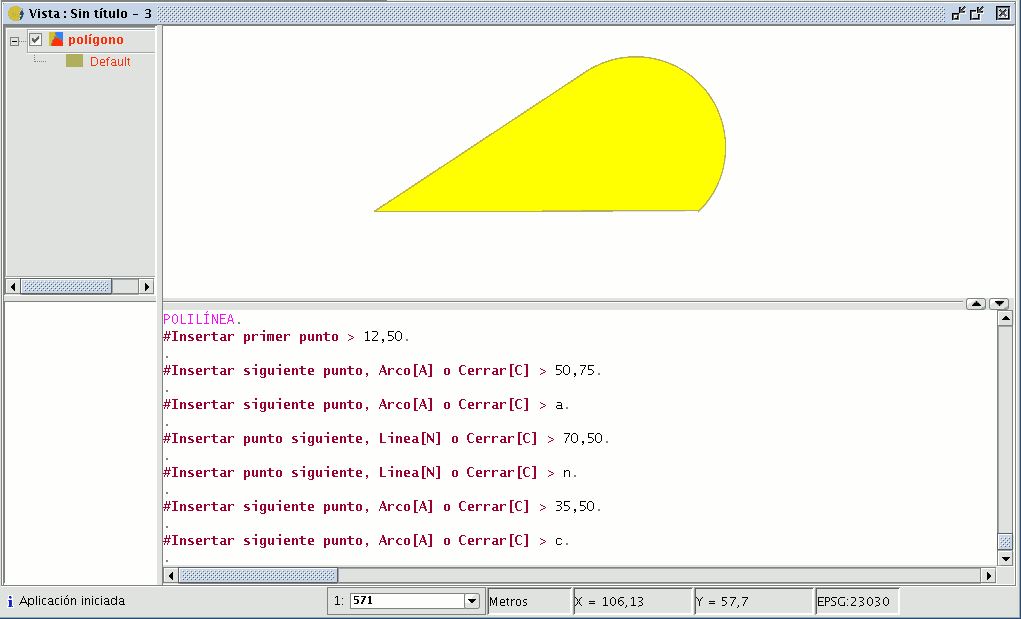
To draw a polyline from the command console, write the command “polyline”. Input the coordinates of the source point. Then you can insert the second point or input one of the parameters to draw an arc “A”, or close the polyline “C”. When you have selected the arc option, you can draw more straight lines using the parameter “N”. The following image shows how the polyline draws a straight line from the arc's last vertex to the source, thus creating a closed figure after inputting the parameter “C”.
Polygon
This option allows you to draw regular polygons which will be handled as a closed polyline. As usual, there are three ways of activating the polygon command. You can select this tool by going to the tool bar and clicking on the "Polygon" button.

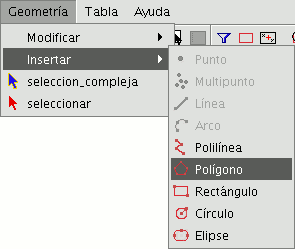
The second option way of activating the tool is by going to the “Geometry” menu bar then to “Insert” and “Polygon”.
To graphically insert a polygon in the drawing, select the tool and then click inside the graphic area on the place you which to position the polygon’s central point.
The application will generate a projection of the object. Move the mouse using the polygon projection as a reference point until it is the size you require, and click on the graphic area once again.
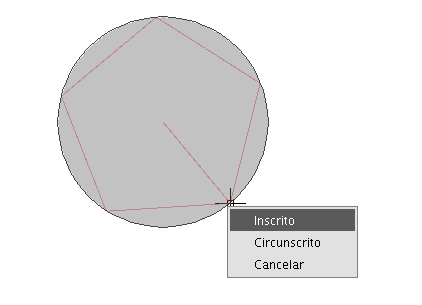
You can tell gvSIG if you wish the polygon you are drawing to be defined as inscribed or circumscribed in the circle. By default, the polygon will be inscribed in the circle. To modify this setting, define the central point of the polygon, right click on the mouse to open the contextual menu and select the desired option.
gvSIG also allows you to modify the number of sides you wish the polygon you are editing to have. To do so, select the polygon object and input the number of sides in the command console.
The third way to select this tool is from the command console. To draw a polygon from the command console, write the command “polygon”, specify the number of sides you wish the polygon to have, whether it should be drawn as inscribed or circumscribed (“I” or “C” respectively), and finally insert the radius, which must be delimited by indicating its length in the units in which the view is defined.
Rectangle
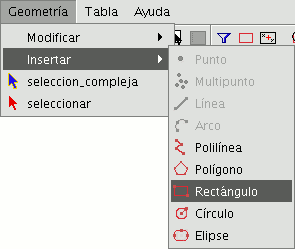
This allows you to draw a rectangle by indicating its diagonally opposite vertices. Click on the “Rectangle” button in the tool bar.

You can also select the tool by going to the “Geometry” menu bar then to “Insert” and “Rectangle”.
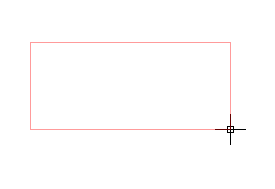
To graphically draw a rectangle in the layer you are editing, select the tool and place the first vertex in the required position in the graphic area. The application will show a projection of the rectangle you are drawing. Move the mouse, choose the position for the vertex diagonally opposite the one you have already inserted and left click on the mouse to define it.
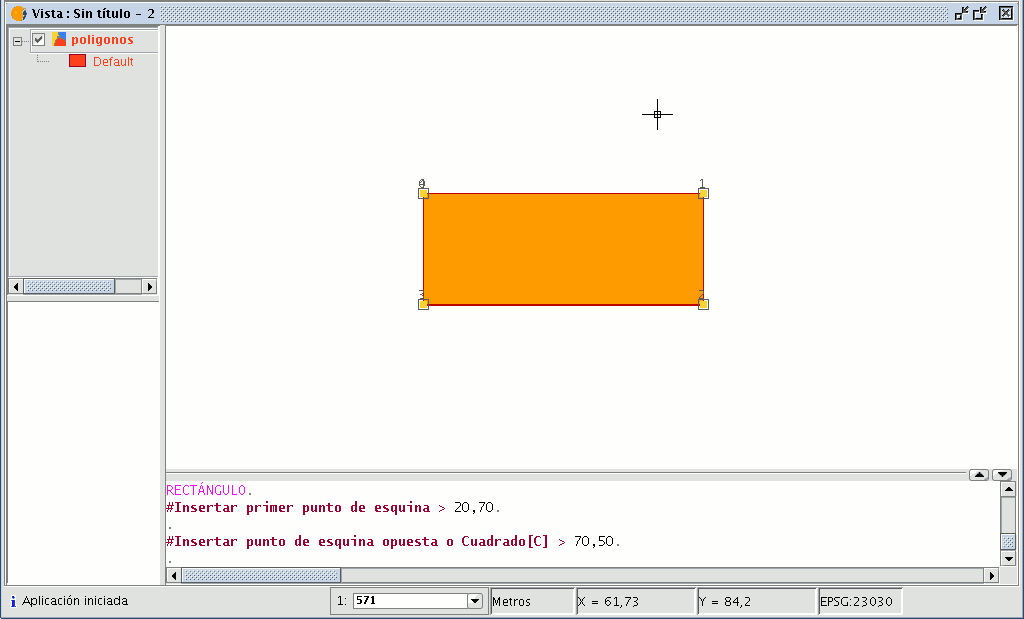
To work with the command console write the command “rectangle” and then input the coordinates for the first vertex and the diagonally opposite vertex.
Square
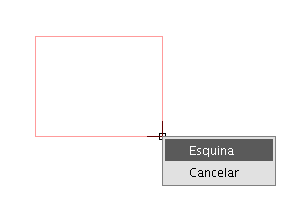
A square is simply a rectangle with equal sides. To prevent possible mistakes when drawing the square, the application allows you to create a square based on a rectangle and makes it have equal sides. To draw a square, first select “Rectangle” and insert the first vertex, then right click on the mouse and click on the “Square” option (“Corner”) in the contextual menu.
The following figure shows an example of the creation of a square from the command console. After the first point of the rectangle has been input, gvSIG is told to make the figure become a square by inputting the letter “C”. You can then insert the opposite corner.
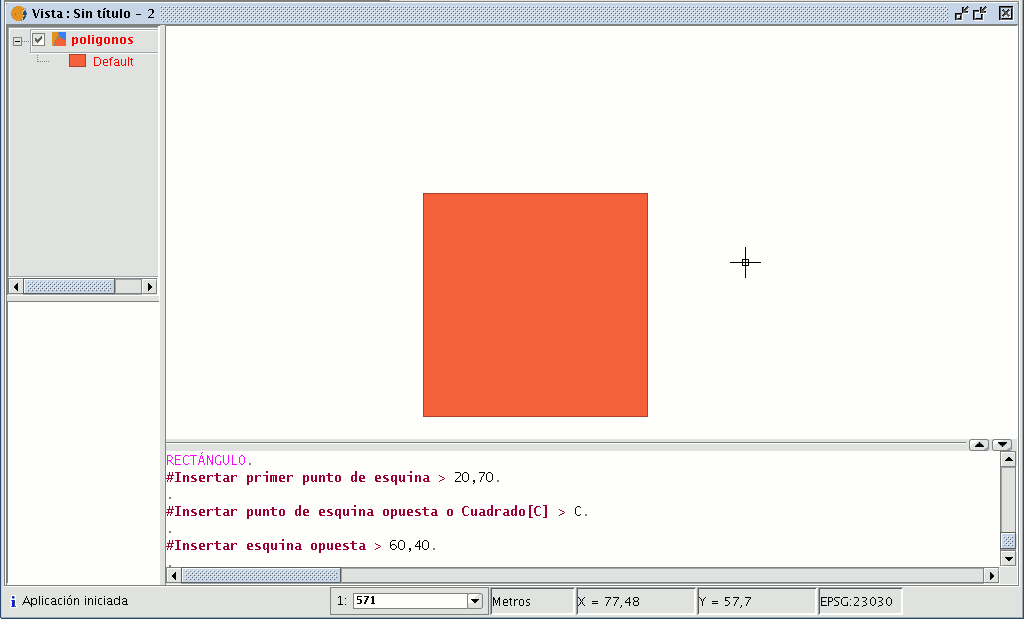
If you make a mistake in inputting the coordinates the application will still draw a square by calculating the size of the vertical line (Y axis), using the coordinate specified for the X axis.
Circle
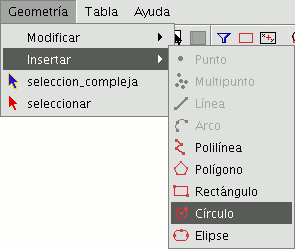
This command draws a circle inside the graphic area. You can select this tool by clicking on the “Circle” button in the tool bar

or by going to the “Geometry” menu bar then to “Insert” and “Circle”, as shown in the figure below.
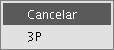
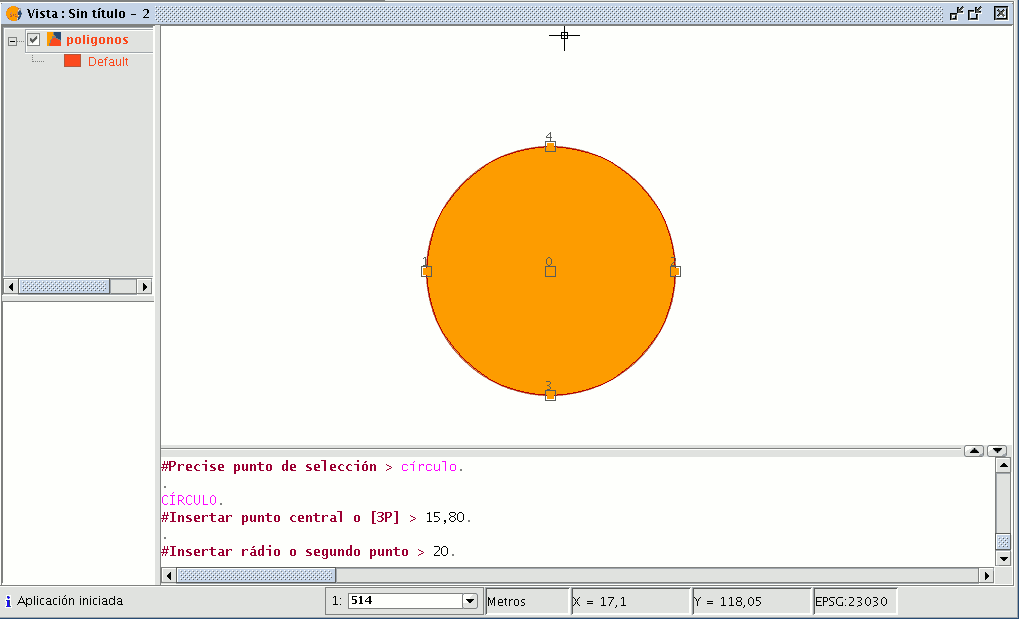
There are two ways of defining a circle. The first option is to define the central point and the radius. Select the “Circle” tool and click on the graphic area in the place you wish to locate the centre of the circle you are drawing. Then move the mouse to increase the radius of the circle until it reaches the required size. gvSIG will, as always, create a projection of the circle as a reference point to show the position of the circle in the drawing. The second way of drawing a circle in gvSIG is to define it by using three points. To access this option to define a circle, first select the tool and then go to the contextual menu by right clicking on the mouse in the graphic area.
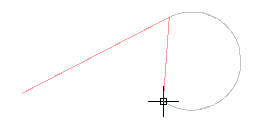
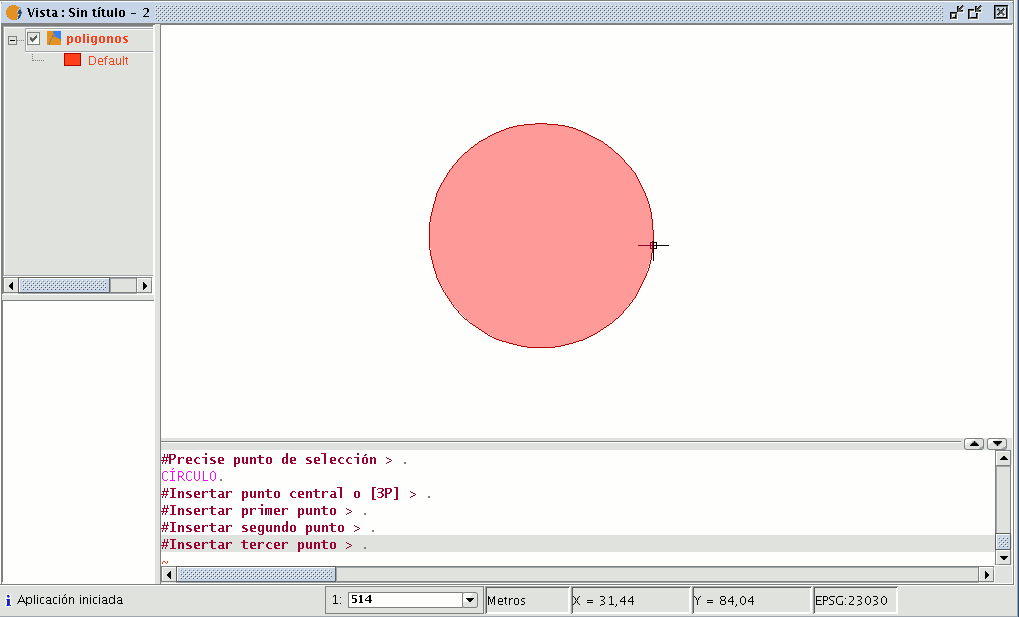
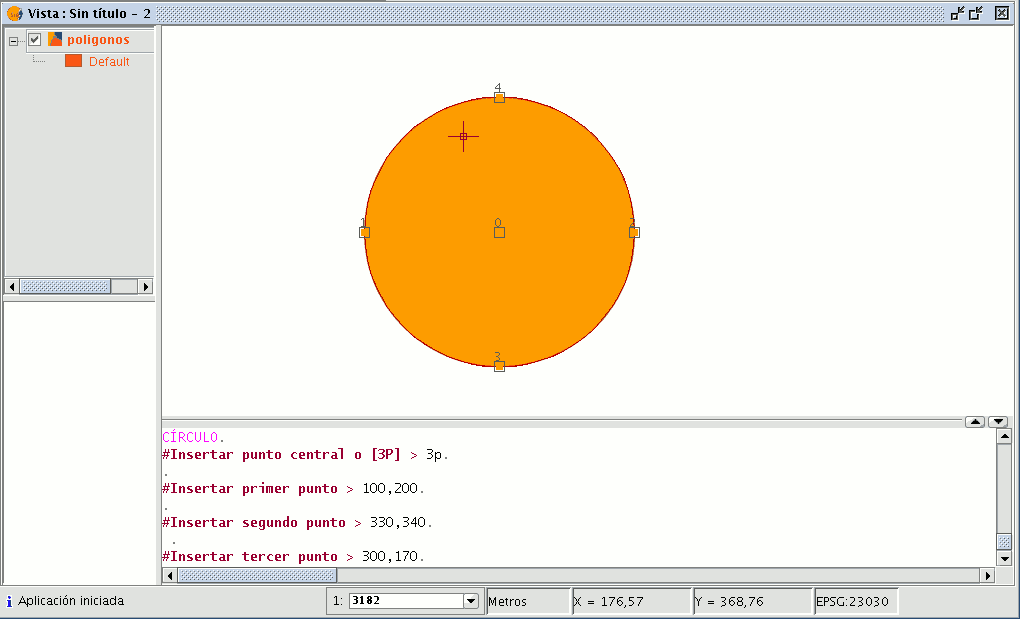
There is only one circle that goes through three given points. When you use this option an elastic circle appears. It is defined by these two points and the cursor until we define the third point, as shown in the figure below.
You can also draw a circle from the command console using any of the methods described above for graphic drawing. Write the command “circle” in the command console and press “Enter”. Insert the coordinates of the central point and then the coordinates of the point that will mark the desired radius or length (use the status bar to check whether you are working in metres or another measuring unit).
To insert a circle from the command console by defining three points, write “3p” when the “circle” command has been activated. When you use this option an elastic circle appears. It is defined by these two points and the cursor until we define the third point, as with the case of the graphic drawing of the circle. The figure below shows how to create a three-point circle.
Ellipse
An ellipse is defined by an axis and the length of the second axis to the centre of the ellipse. There are, as always, three ways of selecting the ellipse drawing tool. To graphically draw an ellipse you can click on the “Ellipse” button in the edition tool bar.

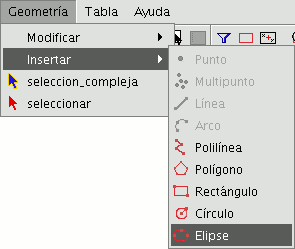
The second option is by going to the “Geometry” menu bar then to “Insert” and “Ellipse”.
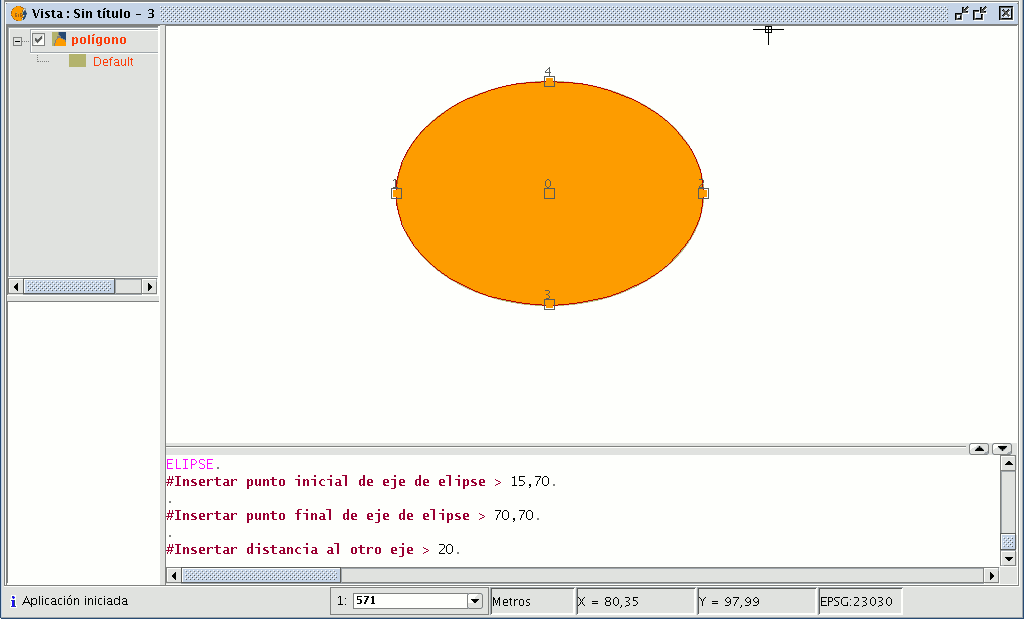
To graphically draw an ellipse, indicate the initial and final points of the ellipse’s axis by left clicking on the mouse in the corresponding places. When the initial point has been input an elastic line will be shown which can be used as a reference point to mark the final point of the axis. When it has been set the ellipse projection will be shown until the third point which marks the distance to the other axis is defined.
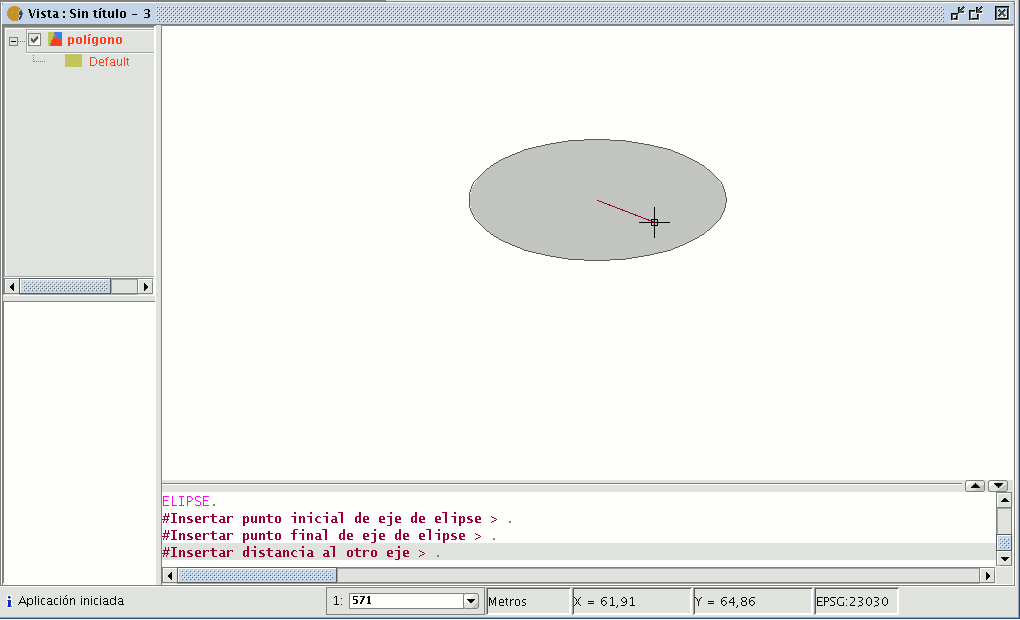
To draw an ellipse from the command console, write the command "ellipse". When gvSIG requests the initial point of the ellipse axis, indicate the point coordinates. It will then request the final point of the axis and finally the distance to the other axis.
Autopolígono
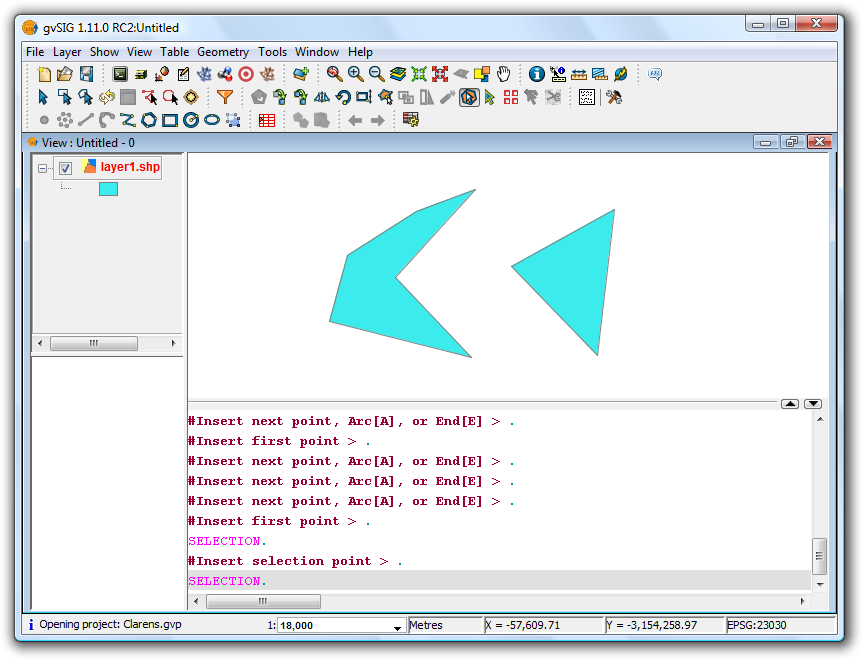
This tool is useful for drawing polygons adjacent to existing ones, thus avoiding having to digitise all the vertices along the common boundary between the polygons.
Therefore it it only necessary to digitise the new sides of the polygon; the tool will automatically generate the common boundaries.
Apart from saving digitising or drawing time, this tool also eliminates overlaps and gaps between two polygons sharing a common boundary.
To use the tool first start editing the layer you wish to work with, and then activate the Autocomplete polygons icon  .
.
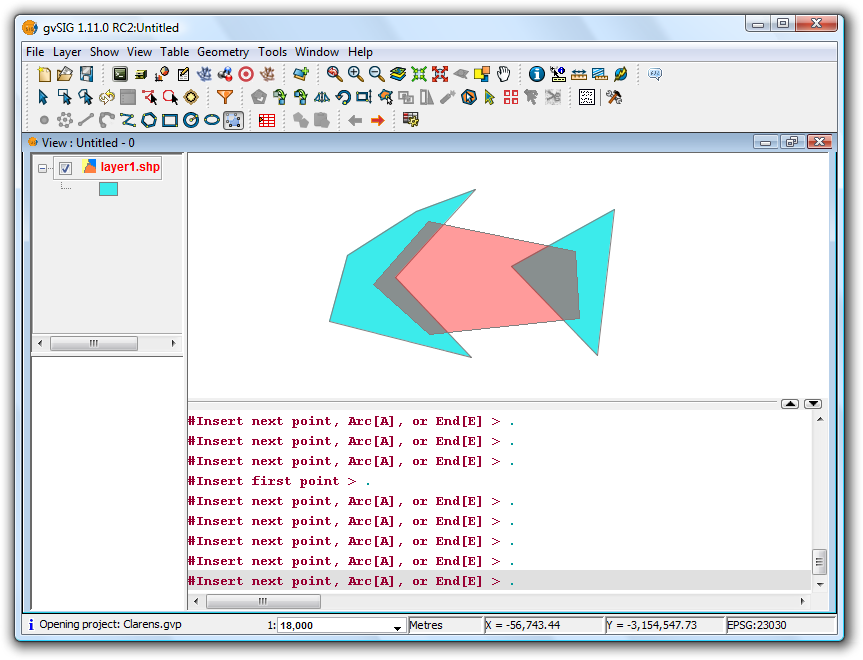
Example of use of the tool
The new polygon can now be drawn without having to digitise the nodes of common boundaries, as shown in the figure below.
Example of use of the tool
Once all sides have been drawn, double-click the mouse or press "E" (end) to terminate the polygon. The figure below shows how the new polygon has been clipped to the common boundaries of the existing polygons.
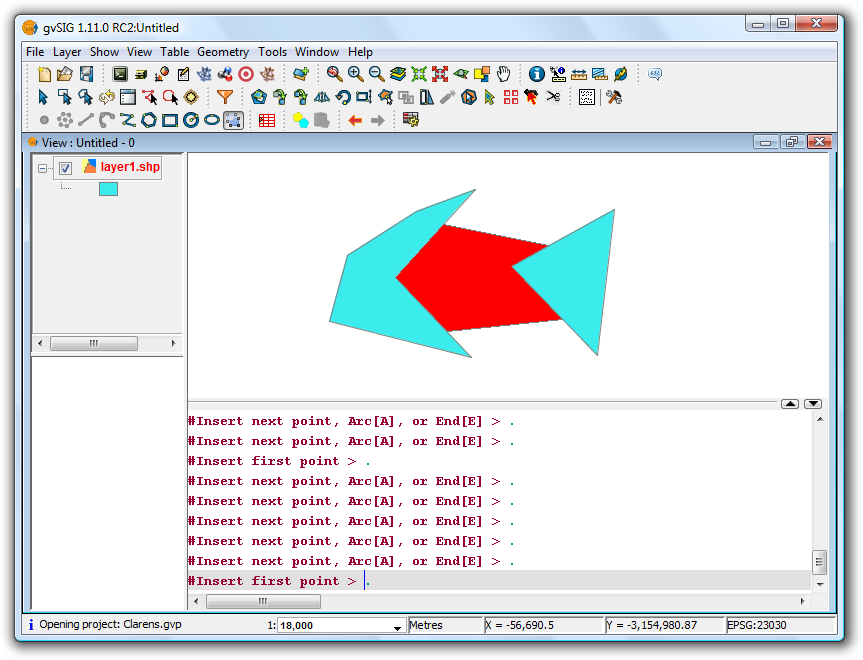
Example of use of the tool


